Vector Layer setup
see also: Data layer, Special layer, Isoline layer
5Back to visualisation start page
The vector layer in LEONARDO supports a huge number of options to generate a nice-looking representation of the wind flow in the model domain.
® Adjust vector scale
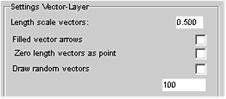
In order to draw the vector arrows in the right size, they must be scaled to the grid point size. Open the vector settings page by clicking on the Vector Layer tab
® Use filled vector arrows
Selecting the "Filled vector arrows" option will create solid tops of the arrow. The direction of the vector is more readable compared to the non-filled vectors, but small vectors will all look the same.
® Select between ordered and random vector display
LEONARDO supports two ways of drawing vectors: the ordered display and the random display. Using the "Draw random vectors" option will produce a more chaotic vector display because the vectors are placed randomly on the map (right image below) rather than in the centre of the grid (left image below).
To adjust the map to your data set, define the number of vectors to be drawn in the box below the option box.
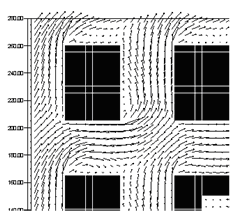
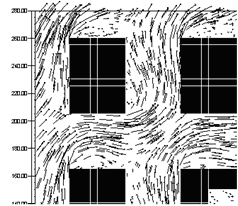
Ordered vector display (left) and random-style vector display
® Selecting the vector color
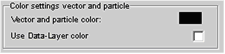
LEONARDO offers a wide range of possibilities to select the color of the vectors
To draw all vectors with the same color, select a color and de-select the "Use Data layer color" option.
If you wish to draw vectors using the data layer colors, select the option "Use Data-Layer color".
The vectors will be displayed according to the color of the data layer.
To adjust the colors, you must fist adjust the data layer key settings so that the colors of the data layer are as you like them to bet (top figure in the example below).
Then, switch off the data layer, and select the "Use data layer color" option.
Now the vectors are drawn with the color of the data layer (bottom figure in the example below).
Important: The data layer must be switched off, otherwise you won't see anything !
Example:
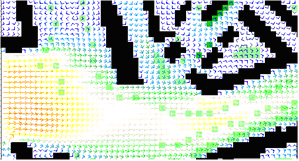
To draw the color of the vector according to their value, the absolute wind speed is stored as variable on the Data layer.
After adjusting the color scale, the data distribution might look as follows:
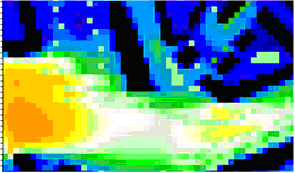
Now, turn off the Data layer and select "Use Data-Layer color" and you will get this result: