Interface Overview
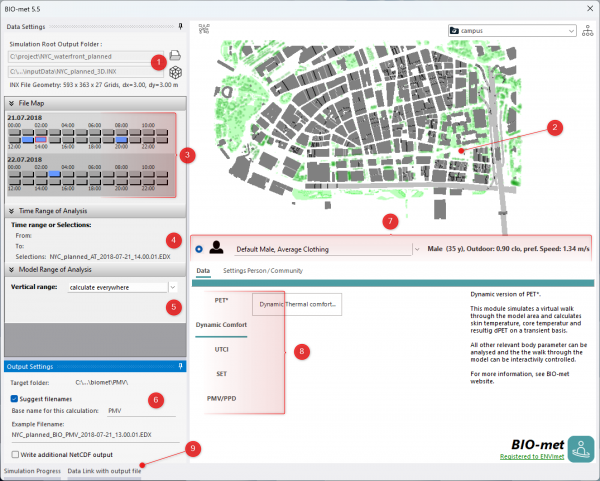
The image below shows the different sections of the BIO-met GUI in overview. This is just a quick walk-around in the GUI- detailed information on how to use the interface are provided in the following pages.
1: Selection of Root Output Folder
In order to perform biometeorological simulations, ENVI-met result data are required. Please select the root folder of your simulation output. The name of the output folder is defined in the .SIMX file of your simulation. You should not store data of more than one simulation run in the same output folder (this is a general advice, not only for BIO-met)
Once the root output folder is set, BIO-met locates the included \atmosphere subfolder and the \input data subfolder. For the moment, the \input data is only needed for visualisation purposes and might be missing. The \atmosphere subfolder is mandatory and must hold at least one valid atmosphere file. The \input data subfolder is generated automatically in each simulation run since Version 5.0 and holds the state of all input files at the time of simulation.
Note: In previous versions of BIO-met, you have been asked to locate the \atmosphere subfolder directly. This has been changed with V5.1
2: Model Area Preview
If you have successfully selected the root output folder and a valid Model Area Input file (.INX) has been found in the \input data subfolder , the model layout is shown in the Model Area Preview window. If vegetation is missing, make sure you have selected the correct active project in the top right of the BIO-met app.
If your model area contain walking routes, they will also be shown in the preview.
3: Data File Map
The Data File Map, like in LEONARDO represents the available singe data files in the \atmosphere folder. Times with existing data are drawn in blue while missing ones or not calculated ones are kept gray. For the BIO-met simulation, you can -using the right mouse button- select either individual files(s) are a time range for which the calculations should be performed. Missing time slots will be ignored. For the simulation of Dynamic Thermal Comfort, only one time points is required.
4: Time Range or selection
This section summarizes the graphical choices and settings from the Data File Map above.
5: Model Range of Analysis
ENVI-met is a three-dimensional model, but you might not be interested in all vertical model heights in your analysis. Here you can restrict the calculation range and hence the calculation time needed. Data outside the selected range will be marked as “No Data” and remain undrawn in LEONARDO or set to -999 in ASCII file exports.
6: Output Settings
This defines the file name logic of the output files generated by BIO-met. All BIO-met outputs are written to the (new) \biomet subfolder of your root output folder.
7: Individual Personal Settings for Simulation
PET* allows to define individual properties of the human body that is simulated in the thermal comfort calculation. Here, you can select a person out of a set of pre-defined persons. In addition, you can modify the settings by selecting the Settings Person/ Community tab below. Please note, that PMV, UTCI and SET always assume standard reference persons, so that settings such as age, gender or height will not have any effect on the results.
8: Selection of Thermal Comfort Index to be calculated
Select the desired Thermal Comfort Index on the left hand side. After checking and adjusting settings, press the available run button(s) to start the simulation
9: Data Link with Input File
This tab allows to link the required data fields from BIO-met with the available fields in the ENVI-met data file. This tab is kept for historical reasons and normally do not require any user interaction.
