This is an old revision of the document!
Thermal Comfort Indices in Biomet
Still a lot of work to do….
In Version 1.0, the list of supported Thermal Comfort Indices is not too long. We are sure that we will extend the abilities of the program in the next future…
Please note, that the different Thermal Comfort Indices are all based on totally different calculation approaches. Hence, some of them react on finde adjustments e.g. in the personal parameter, while others don't. In the description of the parameters below, the sensitivity to input parameters and the limitations of applications are given.
PMV/PPD
The PMV Model (=Predicted Mean Vote Model) is probably the best know human thermal comfort model especially for indoor applications. It is based on Fangers (1972) model, it relates the energy balance of the human body with the thermal impression using a straight empirical function (see below). PMV was originally developed for indoor situations, but by extending the exergy flux related parts of the model with solar and longwave radiation and allowing wind sppeds above an indoor room situation, PMV can also be applied -with limits- to outdoor situations (see e.g. German VDI 3787 Part 2)
Definition range
Normally, the PMV scale is defined between -4 (very cold) and +4 (very hot) where 0 is the thermal neutral (comfort) value:
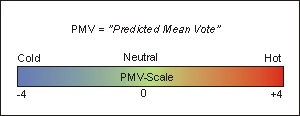
But as the PMV value is a mathematical function of the local climate, in most applications it can reach also values above or below the [-4] - [+4] values, althouth these are off scall of the original Fanger experimental data.
PMV is a stationary value, which means that a person is assumed to be exposed long enough to a constant climate situation until all energy exchange processes at the human body have become stationary. This is, of course, only the case if this person stands exposed to the same climate conditions for quite some time (up to 20 min in some cases).
In addition to the PMV value, ENVI-met provides the associated PPD value (=Predicted Percentage of Dissatisfied) which tells the percentage of people who would be dissatisfied with the climate conditions found. PMV and PPD have a linear relationship (=they can be directly transformed into one another). Therefore the PPD maps have the same spatial structures as the PMV maps have.
$$ PMV=\left[ 0.028+0.303\cdot \exp \left( -0.036\cdot M/A_{Du}\right) \right] \cdot \left( H/A_{Du}-E_{d}-E_{sw}-E_{re}-L-R-C\right) $$ with the terms
- “$0.028+0.303\cdot ...$”: Fitting coefficients to transfer
PET
UTCI
Limits:
- Wind Speed: UTCI as used in the software is limited to a wind speed range of 0.5 to 17 m/s related to 10 m Height
- Height reference: UTCI always related to wind speed at 10 m height while the biometeorological parameters are normally define bewteen 1.5 and 2 m…